How to profile CPU usage using Instruments in Xcode
To profile CPU usage in XCode, run the app then open the Debug Navigator and click on "Profile in Instruments."
To profile CPU usage in XCode, run the app then open the Debug Navigator and click on "Profile in Instruments."
SubscribeDownload Open Source Starter ProjectStep One: Run the App
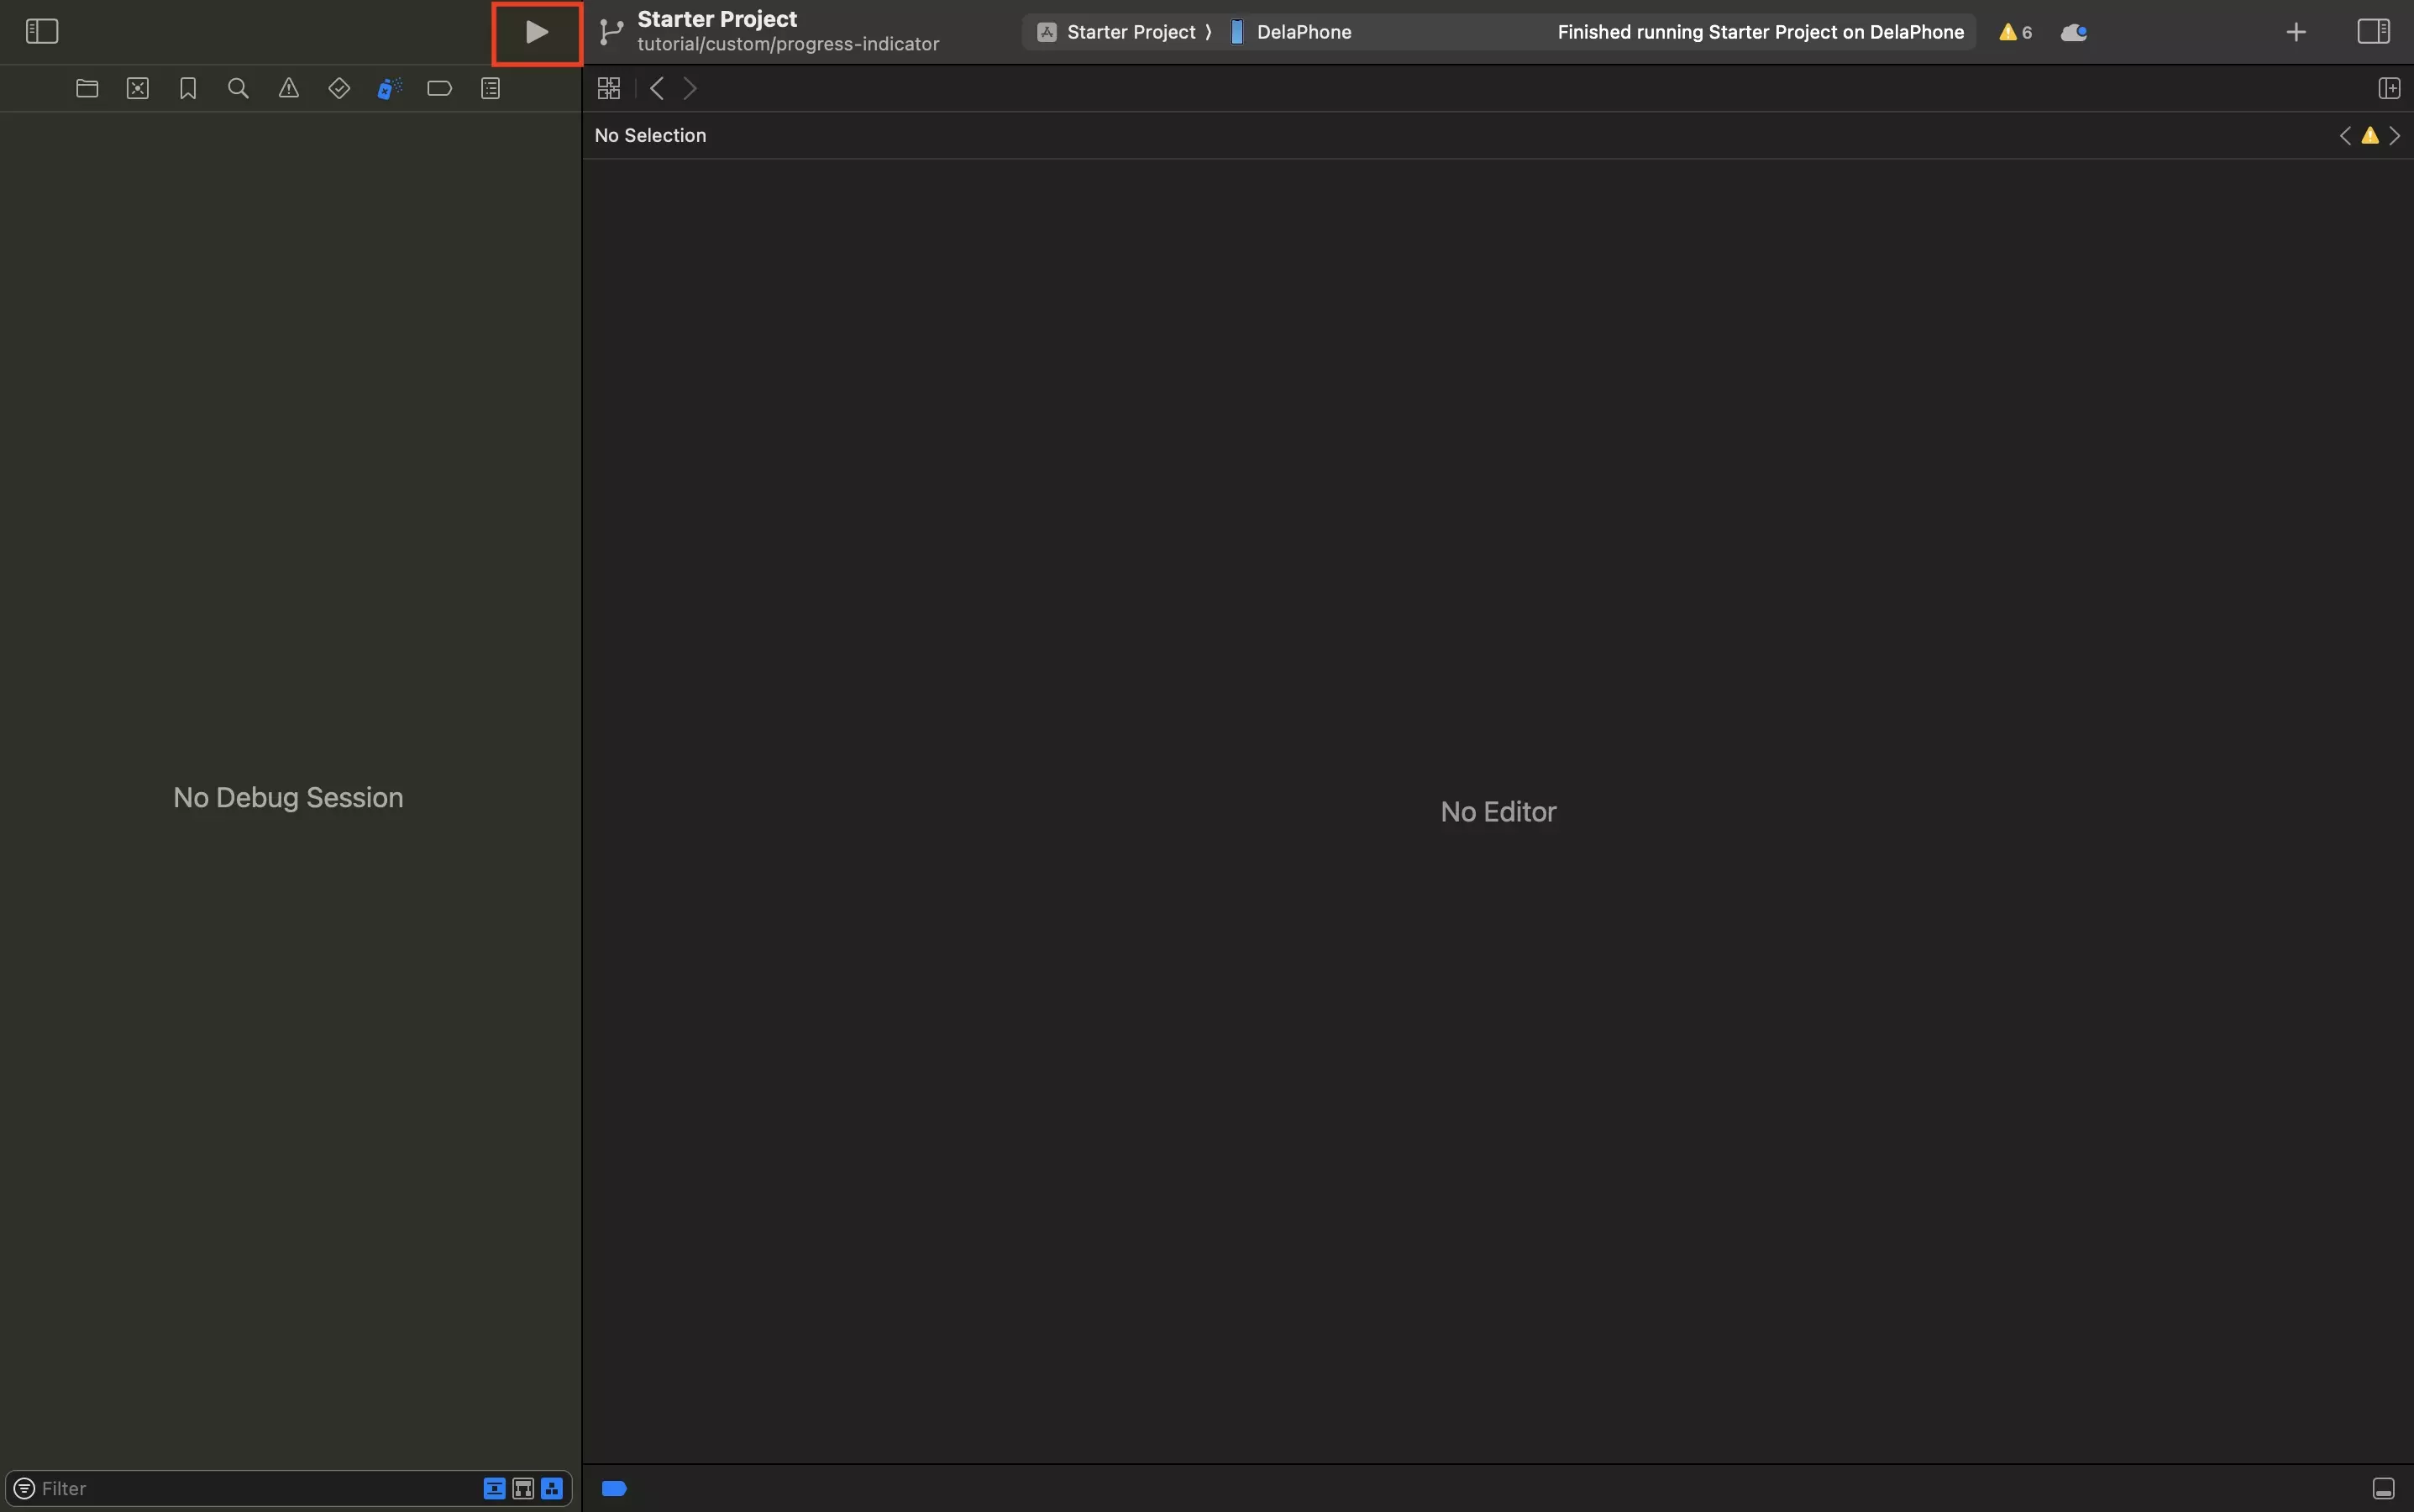
In order to profile the CPU of an app, it must be run from XCode.
Step Two: Profile in Instruments
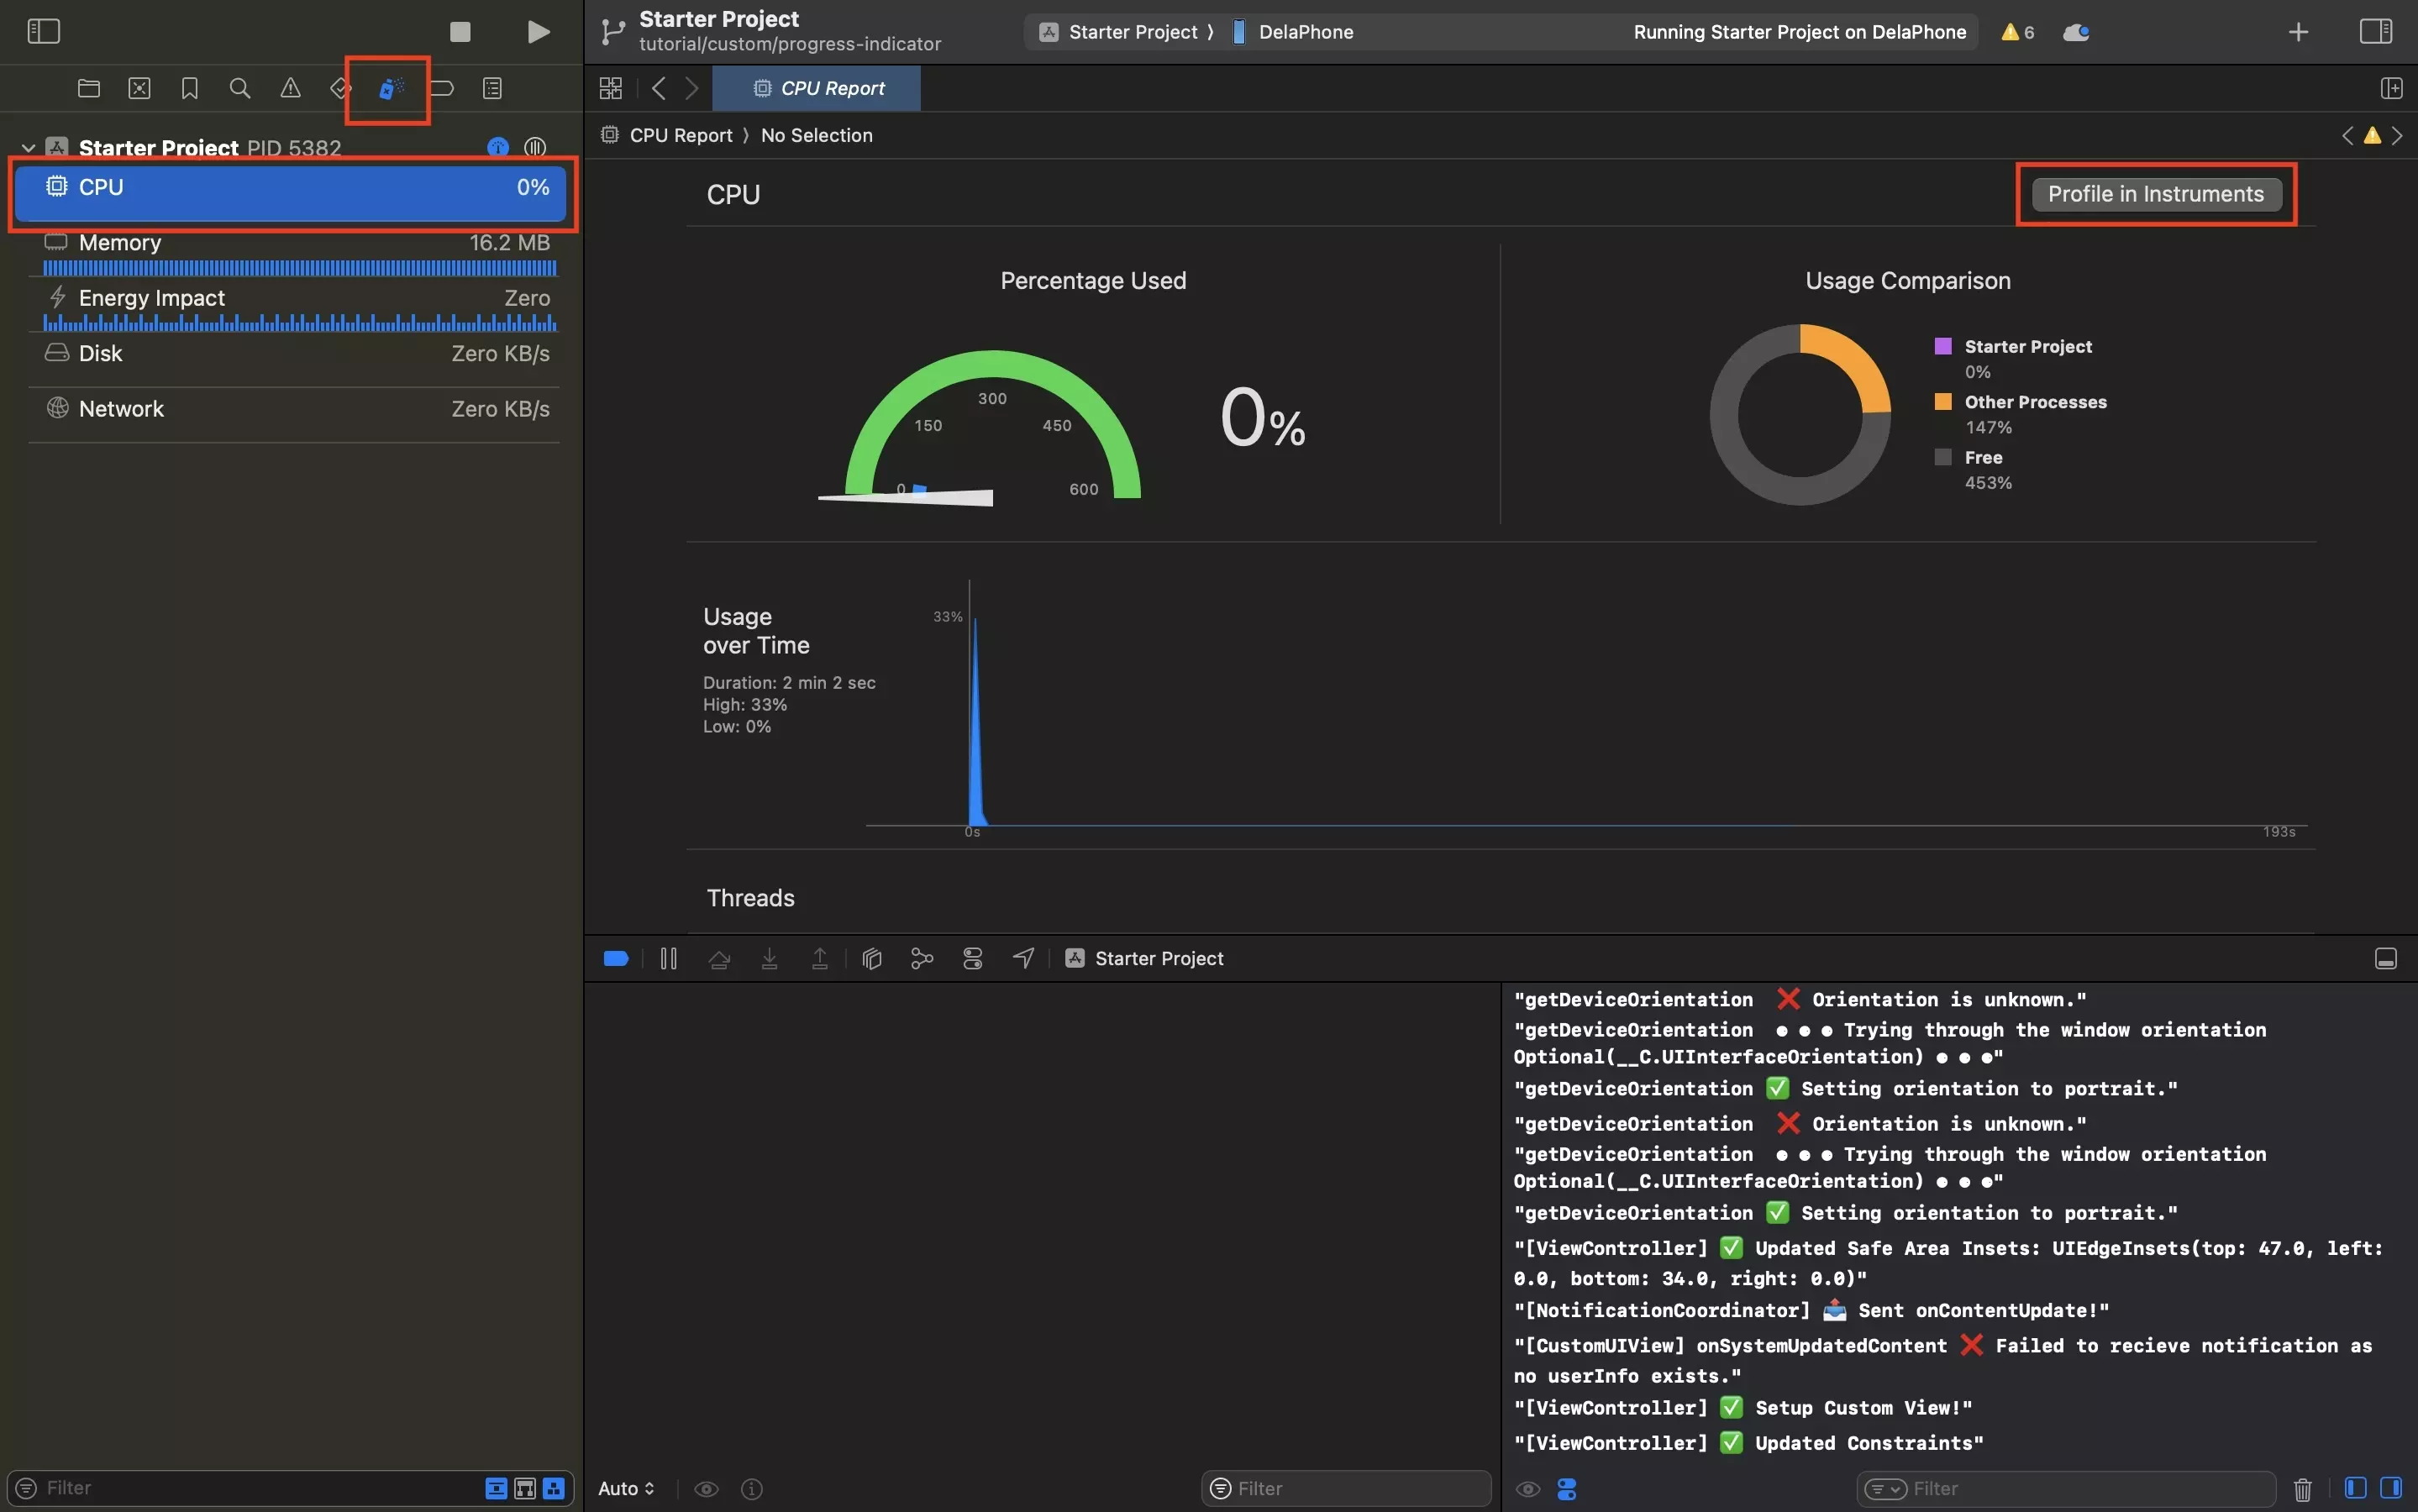
Open the Debug Navigator, select CPU and click Profile in Instruments.
Step Three: Click Profile
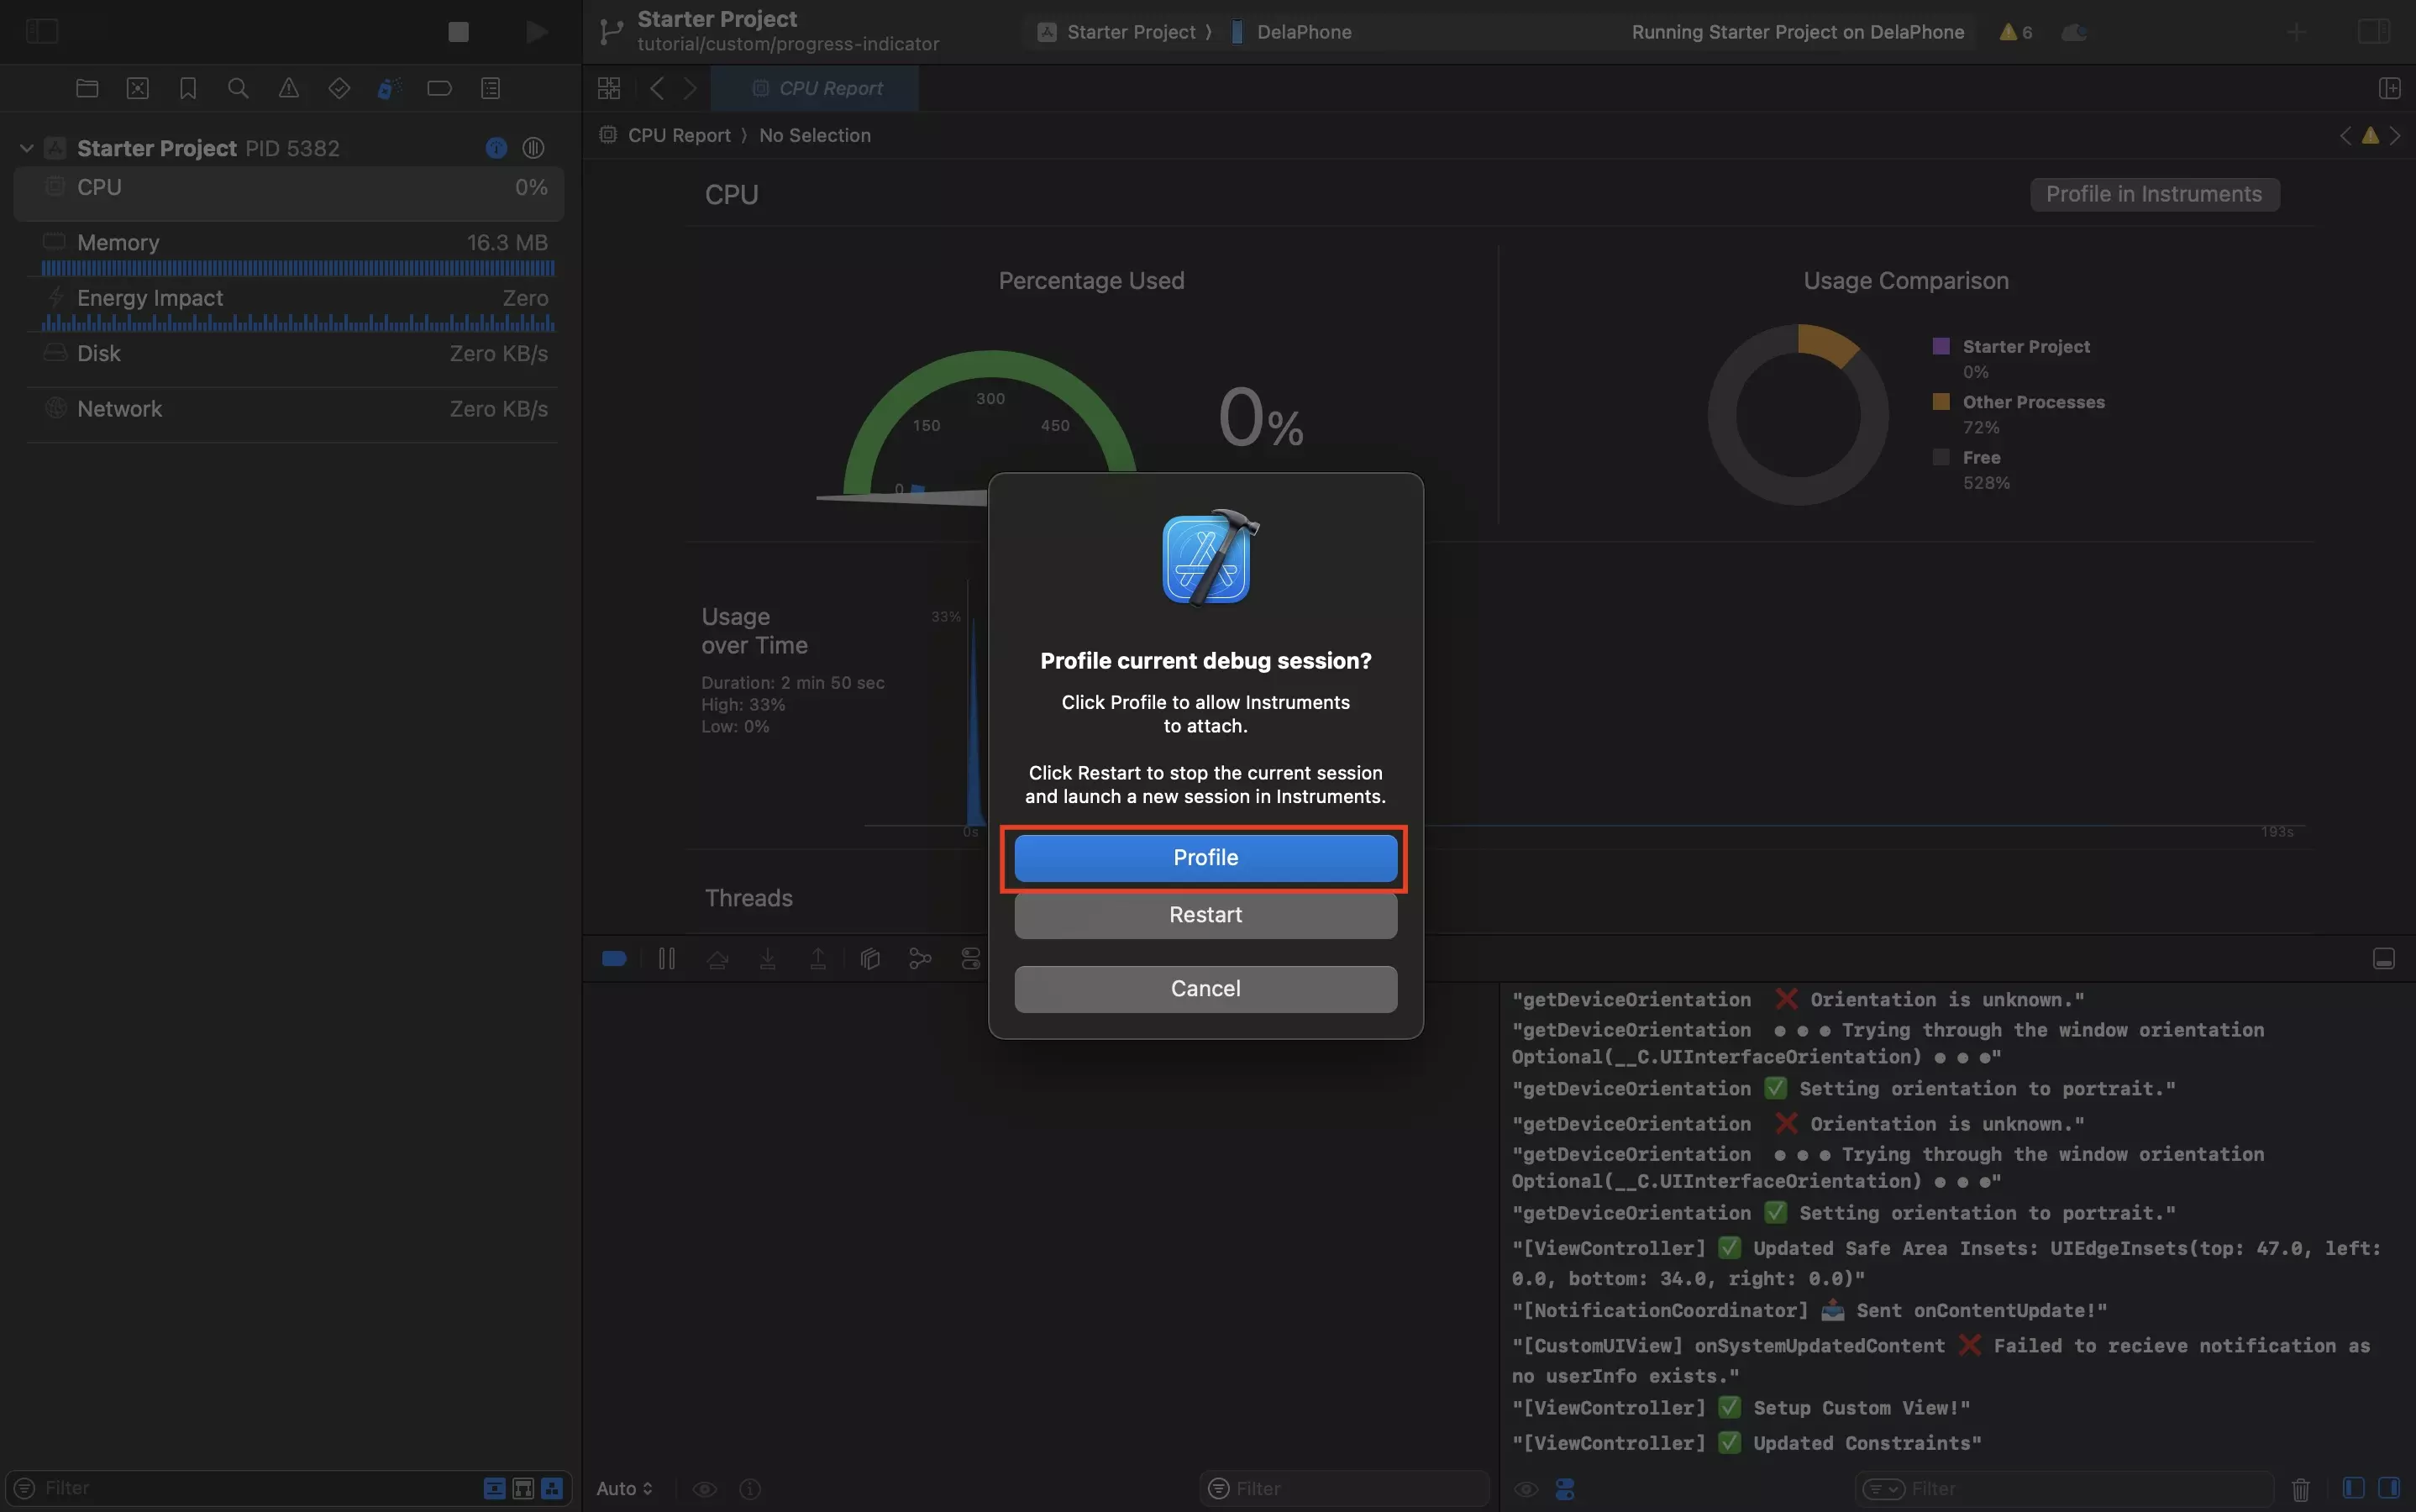
In the pop up that appears, click Profile.
Step Four: Select CPU Usage
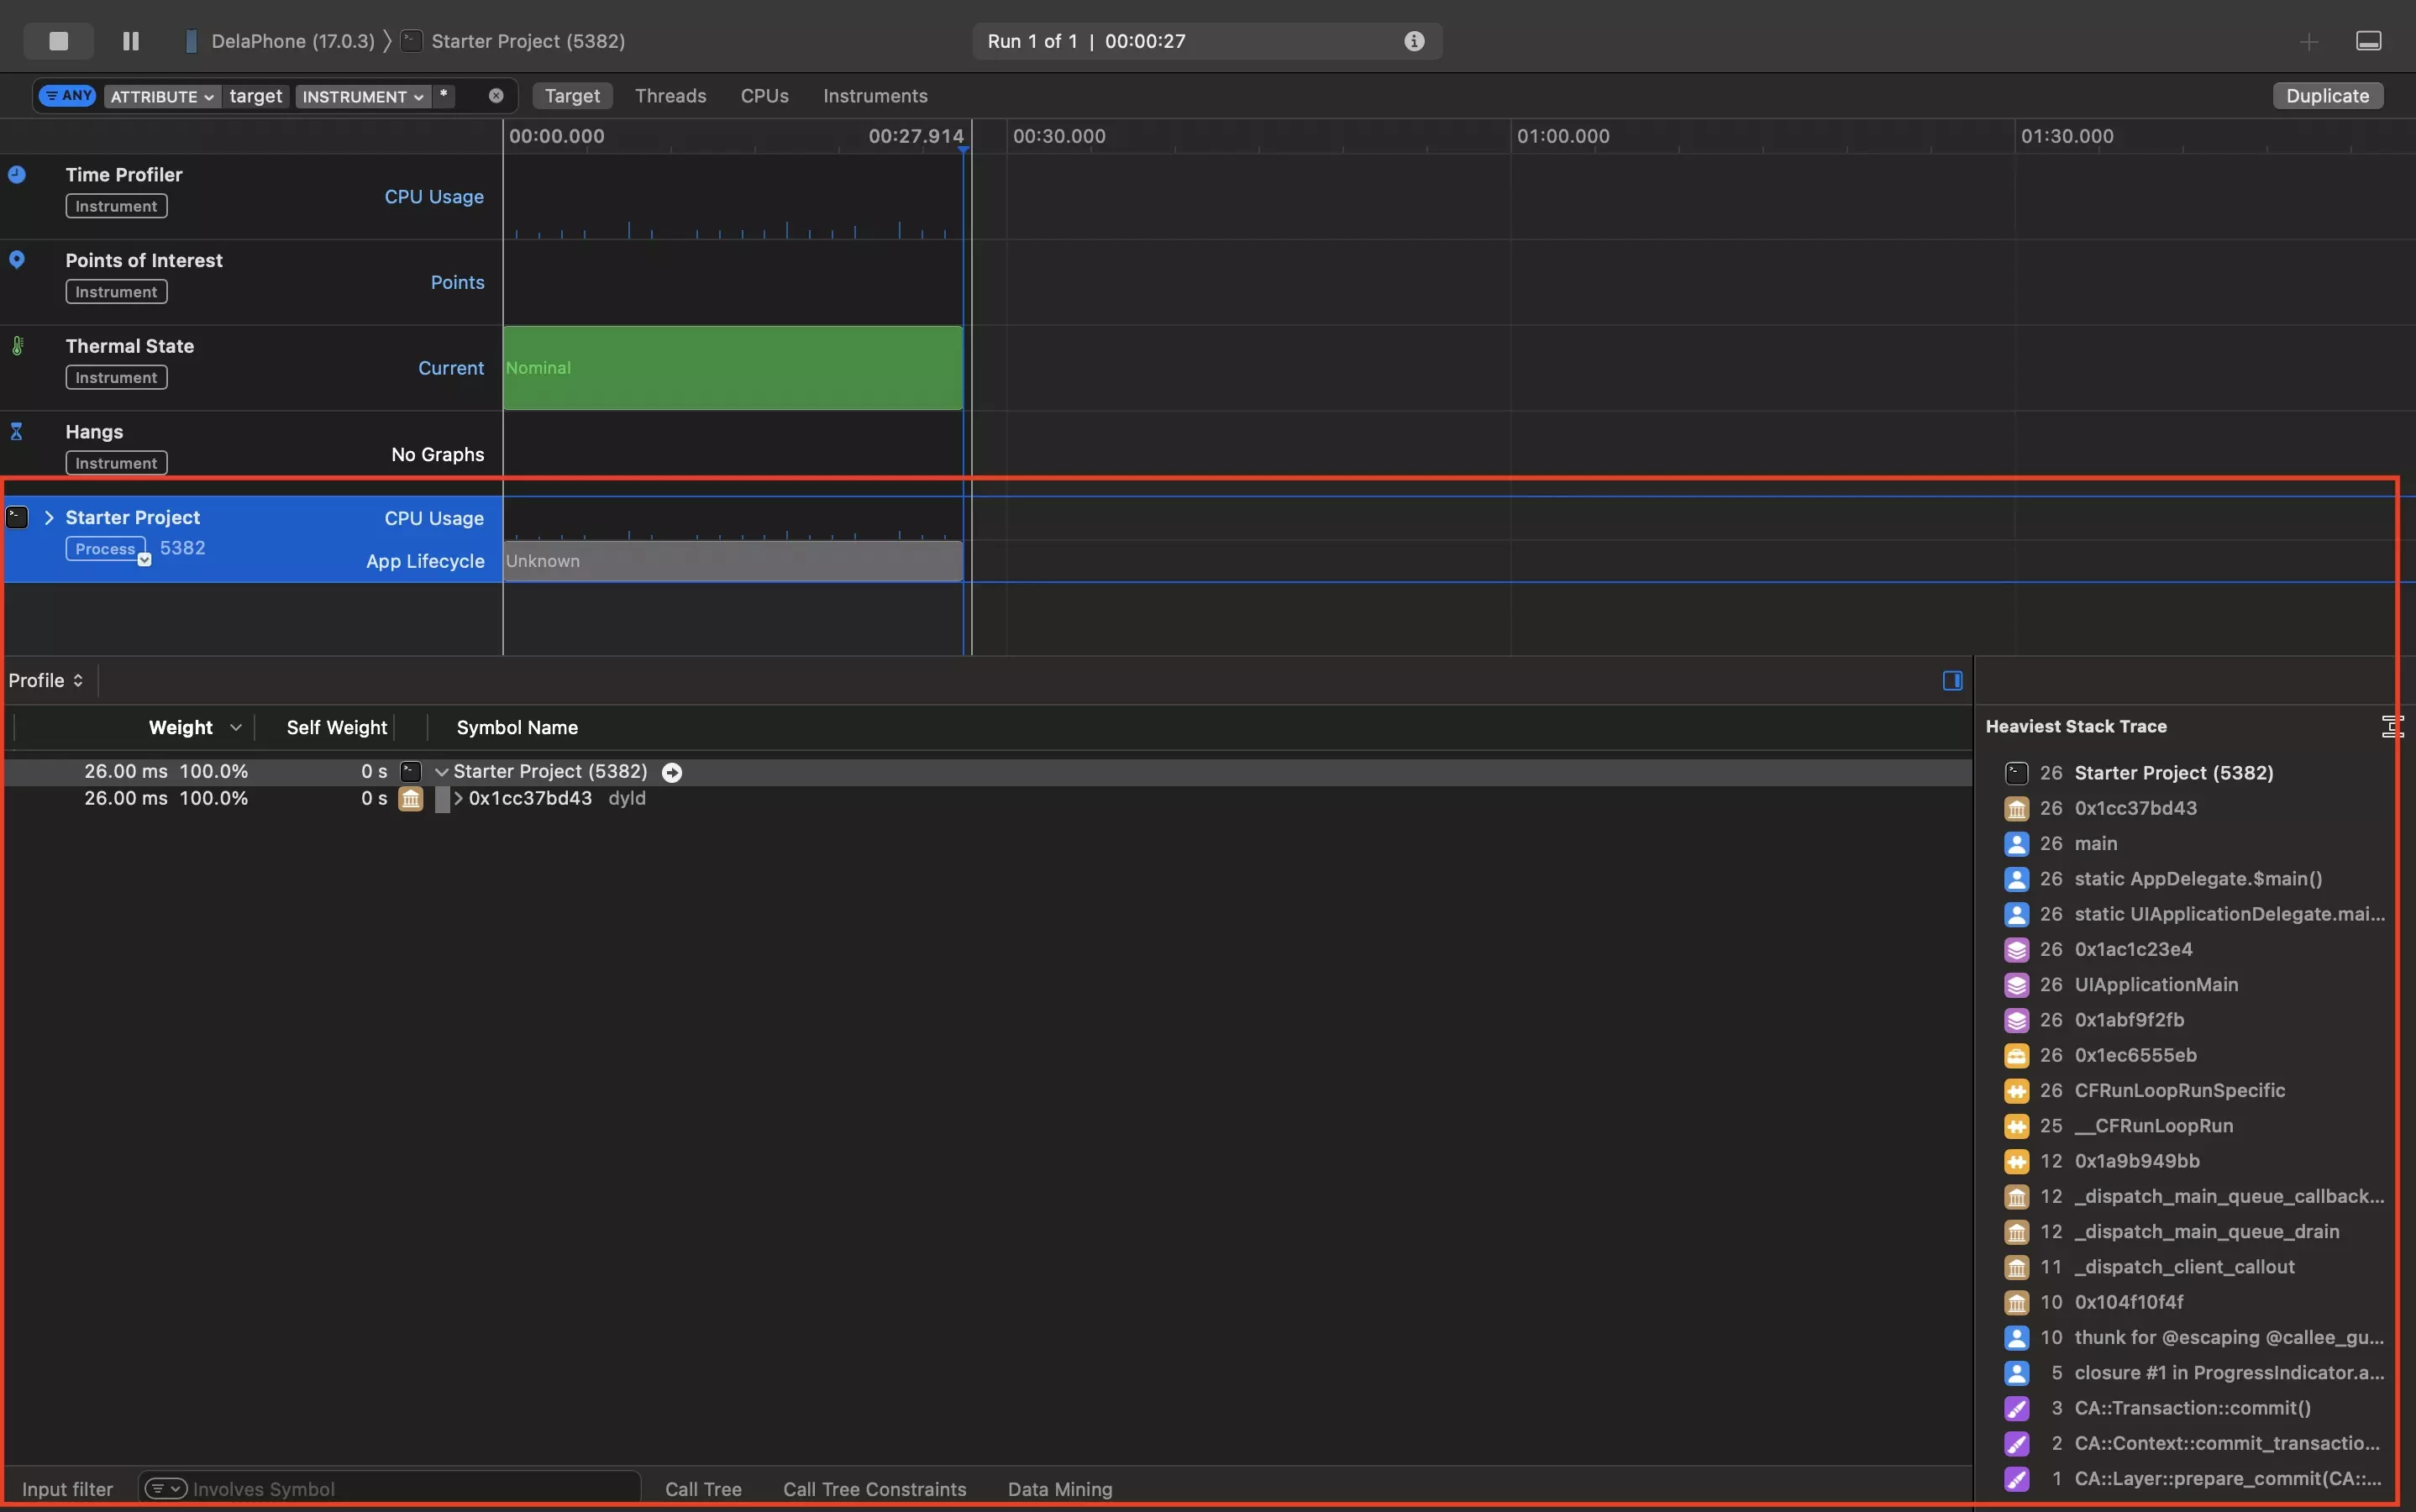
In the Instruments App, select the moment within the CPU Usage bar that you wish to analyze. The results will appear in the stack trace beneath it.
Looking to learn more about things you can do with Swift and XCode ?
Search our blog to find educational content on learning how to use Swift and XCode.