What is a Burndown Chart?
A chart that tracks the completion of a Sprint and offers metrics that help teams predict the amount of work that can be done.

A chart that tracks the completion of a Sprint and offers metrics that help teams predict the amount of work that can be done.
SubscribeWhat is a Sprint?When creating a campaign, feature, product, service or experience it is important to know how much a company, team or individual can sustainably perform in a period of time.
For teams that choose to perform work using Scrum or Agile Methodologies, they can calculate or measure their velocity and ability to do work using a graph known as a Burndown Chart.
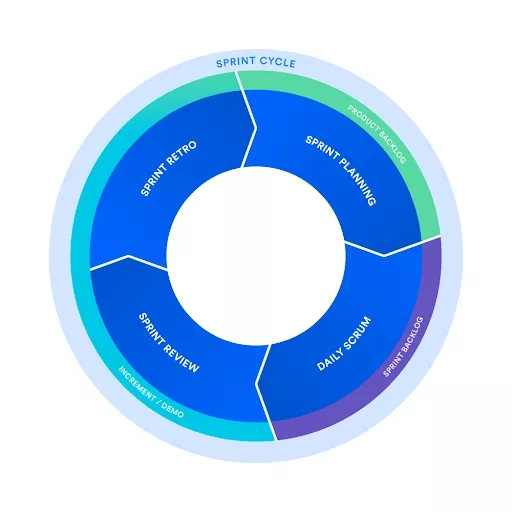
This burndown chart can be used by clients, leadership, product owners, managers or team leads to asses a team's performance as well as to discuss performance during team retrospectives during the Sprint Retrospective scrum ceremony.
"Burndown charts are useful because they provide insight into how the team works. For example:
- If you notice that the team consistently finishes work early, this might be a sign that they aren't committing to enough work during sprint planning.
- If they consistently miss their forecast, this might be a sign that they've committed to too much work.
- If the burndown chart shows a sharp drop during the sprint, this might be a sign that work has not been estimated accurately, or broken down properly."
To learn more about Burndown Charts in JIRA or how to set them up, consult the guide below.
Looking to learn more about Project Management, Technology and Strategy?
Search our blog to find educational content on project management, design, development and strategy.