What are Affinity Diagrams?
An Affinity Diagram, also known as an Affinity Map or Affinity Chart, is a visual tool that allows you to organize information from a brainstorming session into sections, groups or categories.

An Affinity Diagram, also known as an Affinity Map or Affinity Chart, is a visual tool that allows you to organize information from a brainstorming session into sections, groups or categories.
SubscribeAffinity Diagrams are a powerful way to organize ideas in a way that allows you to understand a problem, draw conclusions and take thoughtful action.
Affinity Mapping was invented in the 1960s by Japanese anthropologist Jiro Kawakita. Affinity diagrams are sometimes called the K-J method after Kawakita.
Affinity Mapping is one of the Seven Management and Planning Tools that are used in Japan and worldwide to help organizations make better decisions.
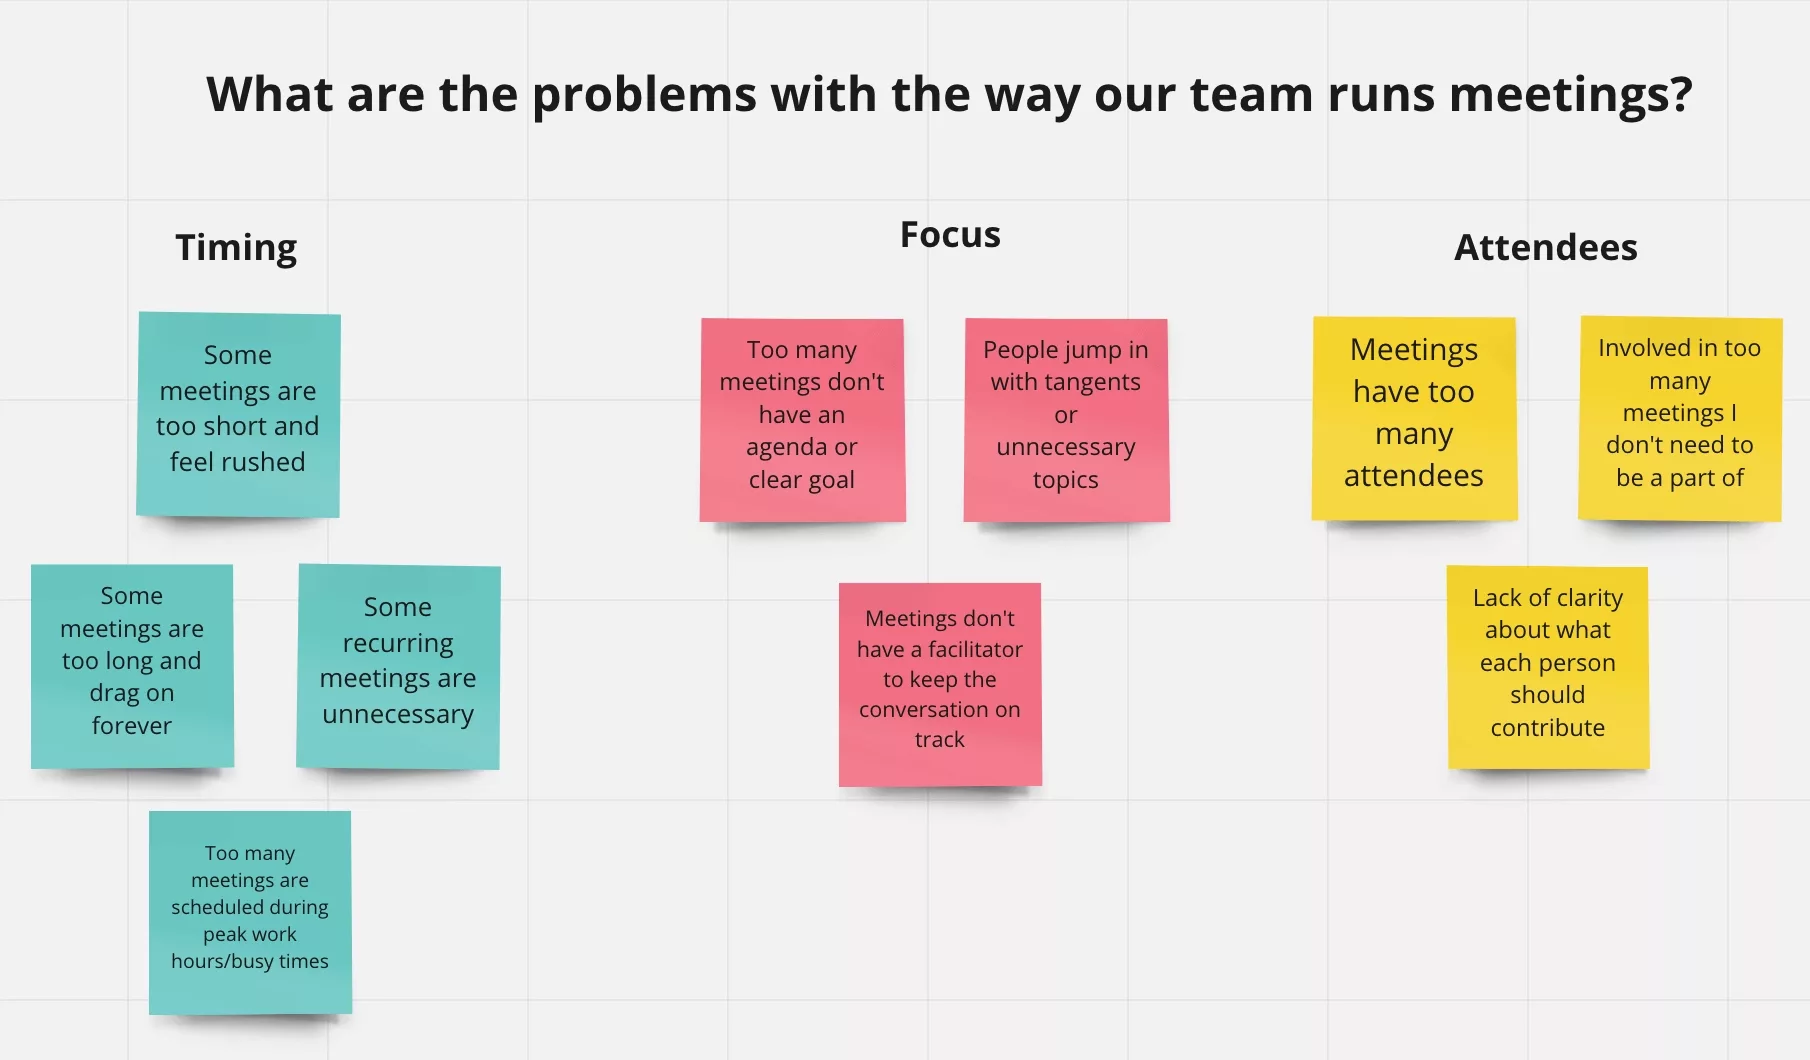
An example of an Affinity Diagram
To learn how to create an Affinity Diagram, consult the link below.
Looking to learn more about Research and Strategy?
Search our blog to find educational content on research and strategy.